Let me be honest: before we talked about agents and NeoCoder, we built a fridge. It was called SKIMO, it came from Zug, it ran in production without a single model, and it was the step from a small model to a bigger one. Alongside we had done object recognition, a model that looks at an image and says what it sees. With SKIMO we tried for the first time to read the future from data. I still have the Jupyter notebook from back then. It is dated 4 December 2019, and when I look at it today I mostly see one thing: that is where we started.
The problem with the vending machine
A vending machine is a strange thing. It has stood everywhere for decades, and still nobody knows what happens inside it. Who buys what, when, how often. What has been sitting in there for three weeks. What has been missing since yesterday. Every online shop knows every click. The vending machine was a black hole.
That was the starting point. Not "we want to do AI". But: a box with food in it should finally know what it is doing.
What SKIMO was
SKIMO was a smart fridge, a smart cabinet, and the software behind it. Online, offline and logistics in one product, that is what we called it back then.
The end customer walks up to the fridge, the app notices by proximity which SKIMO they are standing in front of, no barcode, no QR code. One tap, the fridge opens. You take what you want, close it, done. Payment happens in the background. The app shows products, nutritional values, favourites, what is still there and what is gone.
On the other side: an app for the people who restock, guided step by step. A backend for logistics and planning. A dashboard with everything that was bought. And a cycle that looked like this:
280 products, every movement
How does a fridge know what was taken out? Not with a camera. With tags. Every product had an RFID tag, and the fridge read what was inside and what moved. We could recognise more than 280 different products that way. Not just "is there" or "is gone", but the movement: what was taken out, what was put back, what someone looked at and then did not buy after all.
That sounds unspectacular today. Back then it was the basis for everything that came after. For the first time we did not just have a receipt. We had the behaviour before the purchase. At every time of day, at every location, for every product.
The numbers from the first year
We were live from January 2019. First customer: a Swiss provider of good food in offices. Ten locations, fridges in break rooms.
85 percent repeat buyers within a week. That is the number that stayed with me. People used it without anyone having to explain it. One tap, door open. In 2020 we took it to CES in Las Vegas, after that came conversations with the postal service and retail, in 2022 another test ran.
The notebook from December 2019
Important, before we go on: SKIMO 1 went into production completely without a model. Live inventory, rules, processes, that carried the operation. What follows was a study on the side. We sat there with the data. 280 products, ten fridges, hundreds of users, every movement with a timestamp. And the question: can you predict from that what people will eat next week? When does someone eat rice instead of noodles, in rain or in sun? What sells on Monday, what on Friday? What should the cook make next week, and how much?
I still have the notebook. 44 pages. And honestly it is a document of how you start when you do not yet know how it works.
We pulled the data out of MongoDB and loaded it into pandas. We cleaned product names by hand, because "Sandwich Chicken Barbecue" and "Sandwich Turkey Barbecue" were two completely different things to the model. We tried random forest, gradient boosting and an LSTM to see which approach would take at all. We spun up PySpark on a laptop with 24 gigabytes of executor memory, because we thought that is what you need. And in the end a classic SARIMA model with weekly seasonality delivered the best forecast, with predictions that stayed inside the 95 percent confidence interval over the whole test period.
The most important features according to the decision trees: the product name, the calendar week, the price. Behind those, with less weight, whether a product was vegetarian and which fridge it was in. And in the sales curves you could see a seasonality of about three months.
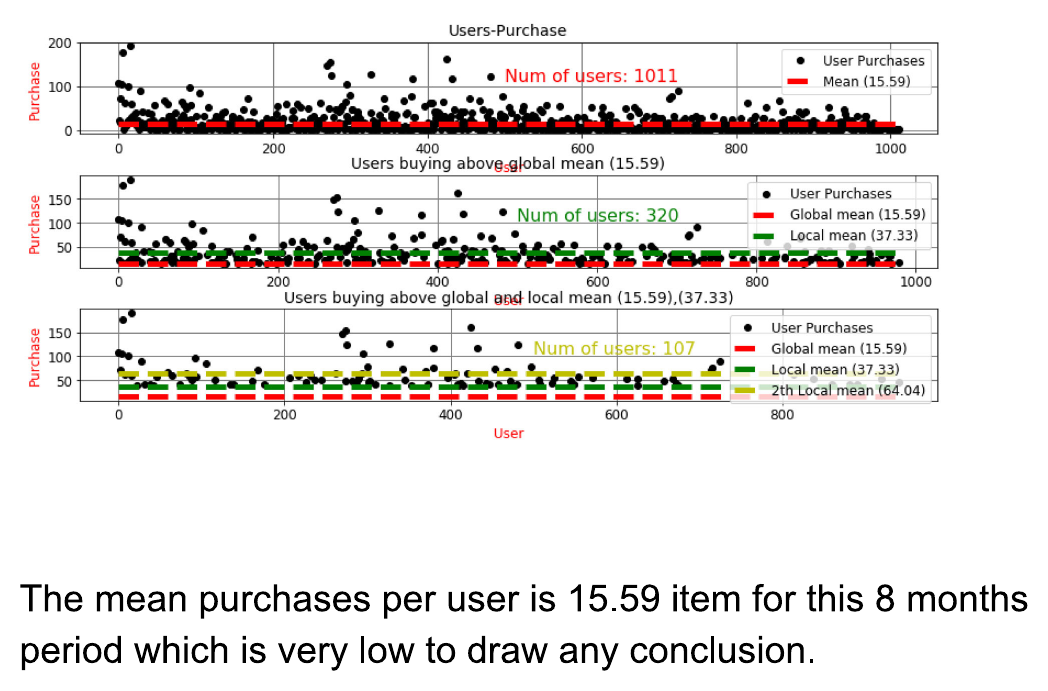
The conclusion in the notebook, in red: sales show a pattern that is well predictable, so a very good optimiser can be built later to minimise food waste while maximising sales. Exactly what we wanted.
What the data told us
But the heading directly below it was the more important one. It read: the reason why the current data is not predictable. And then came three points that I repeat almost word for word today in every first conversation with a CTO.
The data was inconsistent, and there were hardly any relations between the pieces. We had chosen a document database because at the beginning we did not know which data we would have. For analysis that was the wrong decision. The notebook recommends SQL or a graph database, and sketches the graph right there: user, fridge, product, product type, category, active stock. Those were the days. Today it is different: a language model reads the messy documents, finds the relations itself, and embeddings turn "Sandwich Chicken Barbecue" and "Sandwich Turkey Barbecue" into neighbours without anyone drawing a schema. The document database would not be a problem today. The question would be a different one: not which database, but whether the data is good enough for a model to understand it.
There were no categories at the right level. Every sandwich was its own product. The model could not learn that people want "a sandwich" and not "the sandwich with ID 4711". Without categories, every connection between similar products was invisible to the model.
There was no documentation of the stock. If a product did not sell in a given week, nobody could say whether nobody wanted it or whether it simply was not in the fridge. The model learned "no demand" from "not offered". And there was no way to predict what the cook felt like cooking.
That was 2019. We had a model that worked and data that did not deserve it. No big model, no GPU, no neural network that won in the end. A time series model from the seventies and the insight that the work is not in the model, but before it.
What you would do better today
When I open the notebook today, it is like going back to your own childhood. You recognise yourself, you are a little proud, and you put your hand to your forehead.
PySpark with 24 gigabytes of executor memory on a laptop, for a few tens of thousands of rows. Today that runs in pandas in a second, and it would have back then too. An LSTM for data with an average of 15 purchases per person. Cleaning product names by hand, in a function with seven replace calls. And the biggest point: we collected the data for months and only afterwards thought about what structure it would need.
Data model first. Categories, stock as an event, relations between user, fridge and product. Today that comes before the first line of code. Back then it came after nine months of operation, as a proposal in a notebook.
Stock as an event, not as a state. In, out, put back, expired, each with a timestamp. Then you know whether a product did not sell because nobody wanted it or because it was not in the fridge. Exactly the question the model could not answer back then.
Categories from a model, not by hand. Mapping "Sandwich Chicken Barbecue" to "Sandwich" is exactly what our model with the 900 categories does today. Embeddings for the shortlist, a language model for the decision. In 2019 that did not exist like this. We built it years later, and the root is here.
Forecast per category, not per product. "Sandwiches sell on Monday" is a statement a cook can work with. "Product 4711 sells on Monday" is noise.
A fixed test set and a log. Which data, which version, which result. In the notebook the cells sit in the order we ran them, and nobody could reproduce them today. That is the difference between a study and a system.
And simply: more data before more model. The note under the chart was the smartest line in the whole notebook. 15 purchases per person are not enough. No model in the world turns that into a forecast. You have to collect longer, collect cleaner, and then compute.
The nice thing: none of this is hard today. All of it is standard today, in every project, before anyone says AI. And the reason we know it is that we did not know it back then.
What stayed
That the data is the product. The fridge was the hardware, the app was the surface, but what counted in the end was the series of movements with timestamps. And that you have to store that data from the start in a way you can analyse later. Categories, stock, relations. Not only once someone asks the question.
That the question comes before the model. "What sells next week" is a good question. "Show me everything" is not. Today that is the first question in every project: which decision should get better?
And that the step from a small model to a bigger one is not a step in technology, but in the question. Object recognition answers "what is this". A forecast answers "what will be". The second does not need more compute. It needs better data and a clearer question. The best result in the notebook did not come from the LSTM, but from SARIMA. Everything that came after, our own models, the 900 categories, NeoCoder, was built on that experience: first the data, then the question, then the model. Not the other way round.
You do not start with AI because you want to. You start because you have data and a question it can answer. For us it was a fridge in a break room and a 44-page notebook that told us what we did not know yet. What was it for you?
Written by me. The thoughts, the values, the learnings, the mistakes: all mine. Grammar and spelling are corrected by our own twin model, trained on my texts. Sometimes a stumble stays in. That is mine too.